Using PlotData with Dessia’s platform#
Select objects#
When drawing multiple objects on one figure, one feature of interest can be to select these objects on the plot and to get them downloaded from the database and displayed on a table below the figure.
The DessiaObject Dataset implements it by default by adding an attribute reference_path to each displayed element in the object container:
# self is an object container where objects are stored in the attribute "dessia_objects"
def _object_to_sample(self, dessia_object: DessiaObject, row: int, reference_path: str = '#'):
   sample_values = {attr: self.matrix[row][col] for col, attr in enumerate(self.common_attributes)}
   reference_path = f"{reference_path}/dessia_objects/{row}"
   name = dessia_object.name if dessia_object.name else f"Sample {row}"
   return pld.Sample(values=sample_values, reference_path=reference_path, name=name)

# The vector of elements (or Samples) is built with an additional key attribute:
# reference_path, which is '#/dessia_objects/i' where # is the path of the Dataset
# and i is the DessiaObject index.
def _to_samples(self, reference_path: str = '#'):
    return [self._object_to_sample(dessia_object=dessia_object, row=row, reference_path=reference_path)
            for row, dessia_object in enumerate(self.dessia_objects)]

# The Scatter draws the previously built samples
@plot_data_view("Scatter", load_by_default=True)
def scatter(self, reference_path: str = "#"):
            samples = self._to_samples(reference_path)
            return pld.Scatter(elements=samples, x_variable="period", y_variable="speed")
From the platform view, selecting referenced objects (i.e. with a specified reference_path) on a plot will make a table appearing below the figure (warning: data are not from the pendulum example):
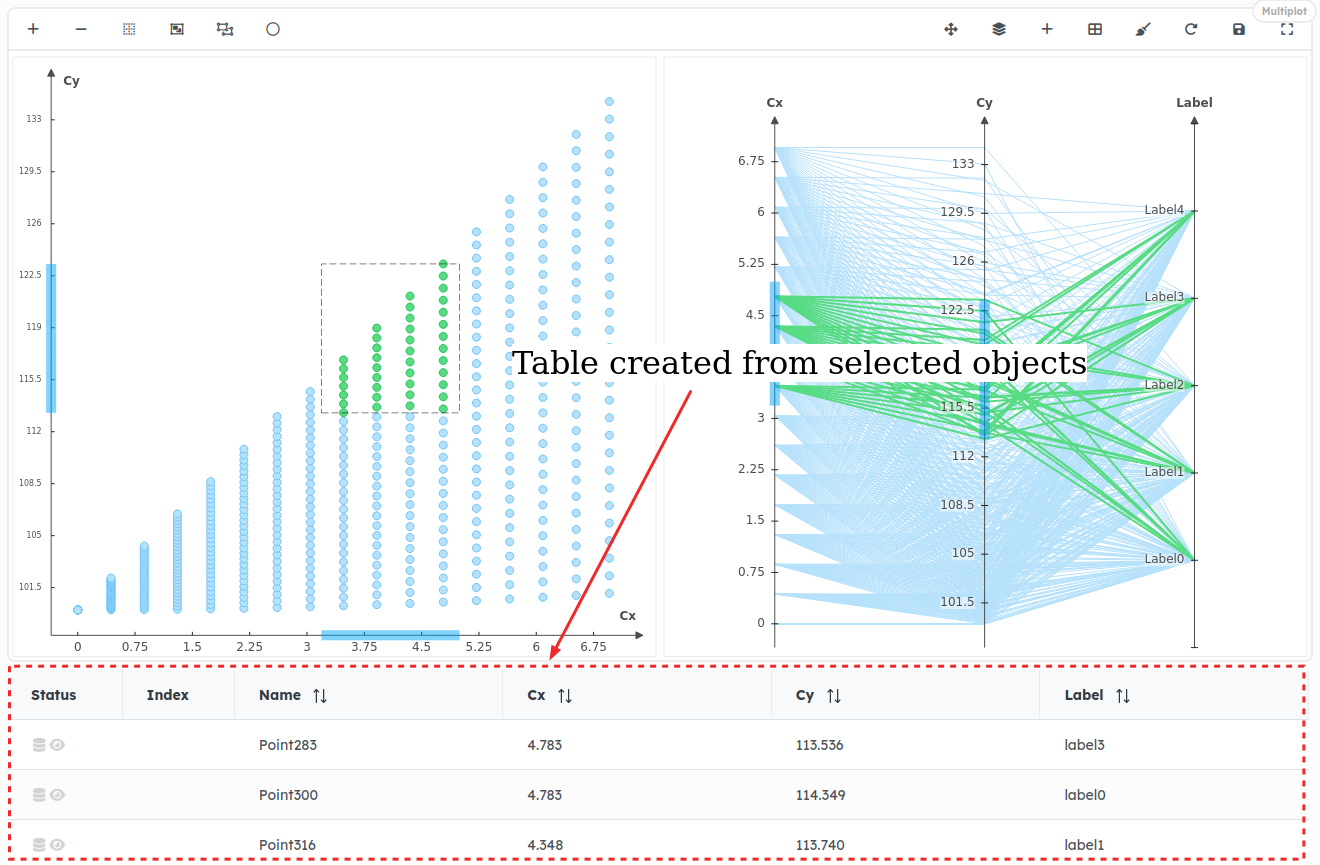
To select several objects on a figure, several features are available:
Ctrl + click: Press Ctrl and click on several points.
WARNING: Points selected this way can not be added to a Point Set (see below)
Selection box: Press Shift and draw a Selection Box by clicking and dragging mouse on a Frame plot (Scatter, Histogram)
Buttons: Click on the Selection button and draw a Selection Box by clicking and dragging mouse on a Frame plot (Scatter, Histogram)

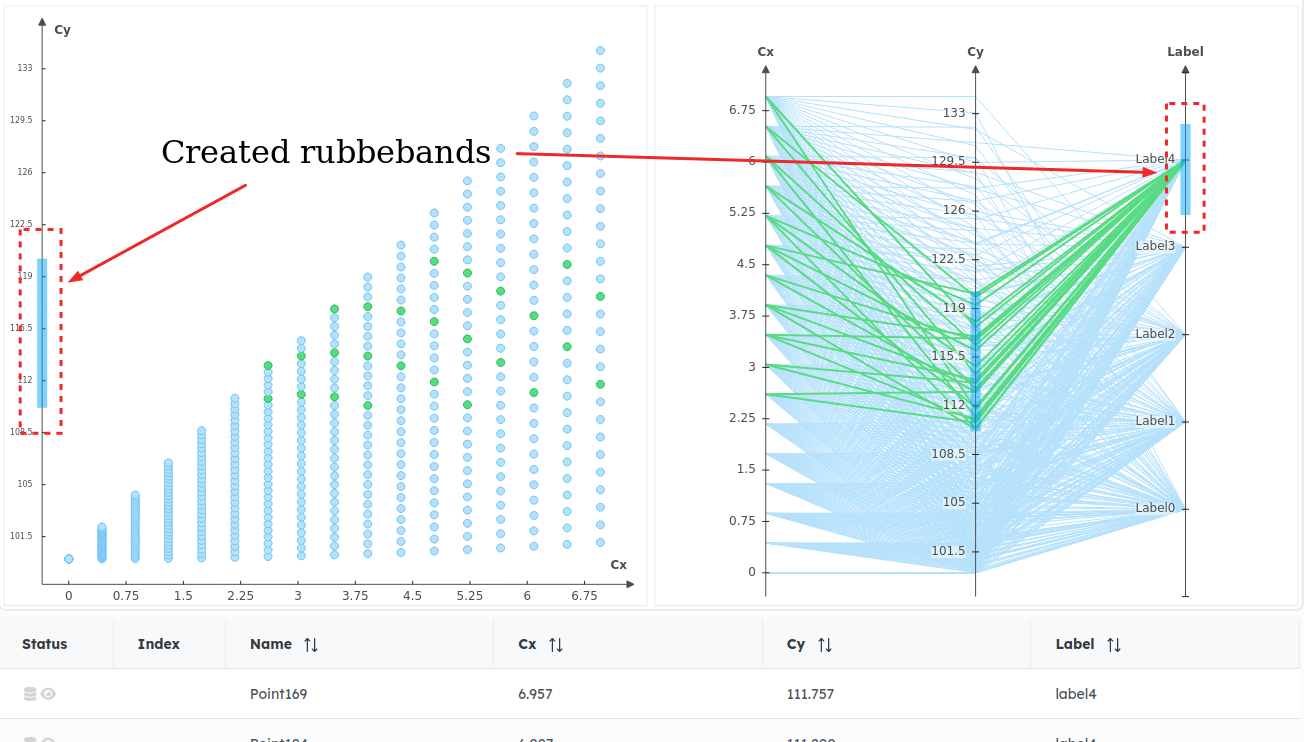
Filters with rubberbands: Click and drag mouse on any axis of Scatter, Histogram or ParallelPlot to create a Rubberband that allows to select range of values:
Handle view#
The view on figures can be handled by user’s manipulations. Available methods are:
Mouse buttons: Click and drag or wheel mouse to handle the view box and the zoom level,
Zoom box: Click on the Zoom Window button to activate the Zoom window tool to define new minimums and maximums on displayed axes of Frame figures (Draw, Scatter, Histogram) thanks to a Zoom window that is drawn with mouse click and drag,

Buttons (vertical / horizontal , merge points):
Merge points on Scatter with `Merge Points` button: Activate this option for performances when drawing a Scatter plot. It will merge some points to down scale the number of drawn points, for performance reasons,

Switch from Vertical axes to Horizontal axes on Parallel Plots: Click on Change disposition button to switch from vertical to horizontal layout (and inverse) on parallel plots

Add figures on Multiplot#
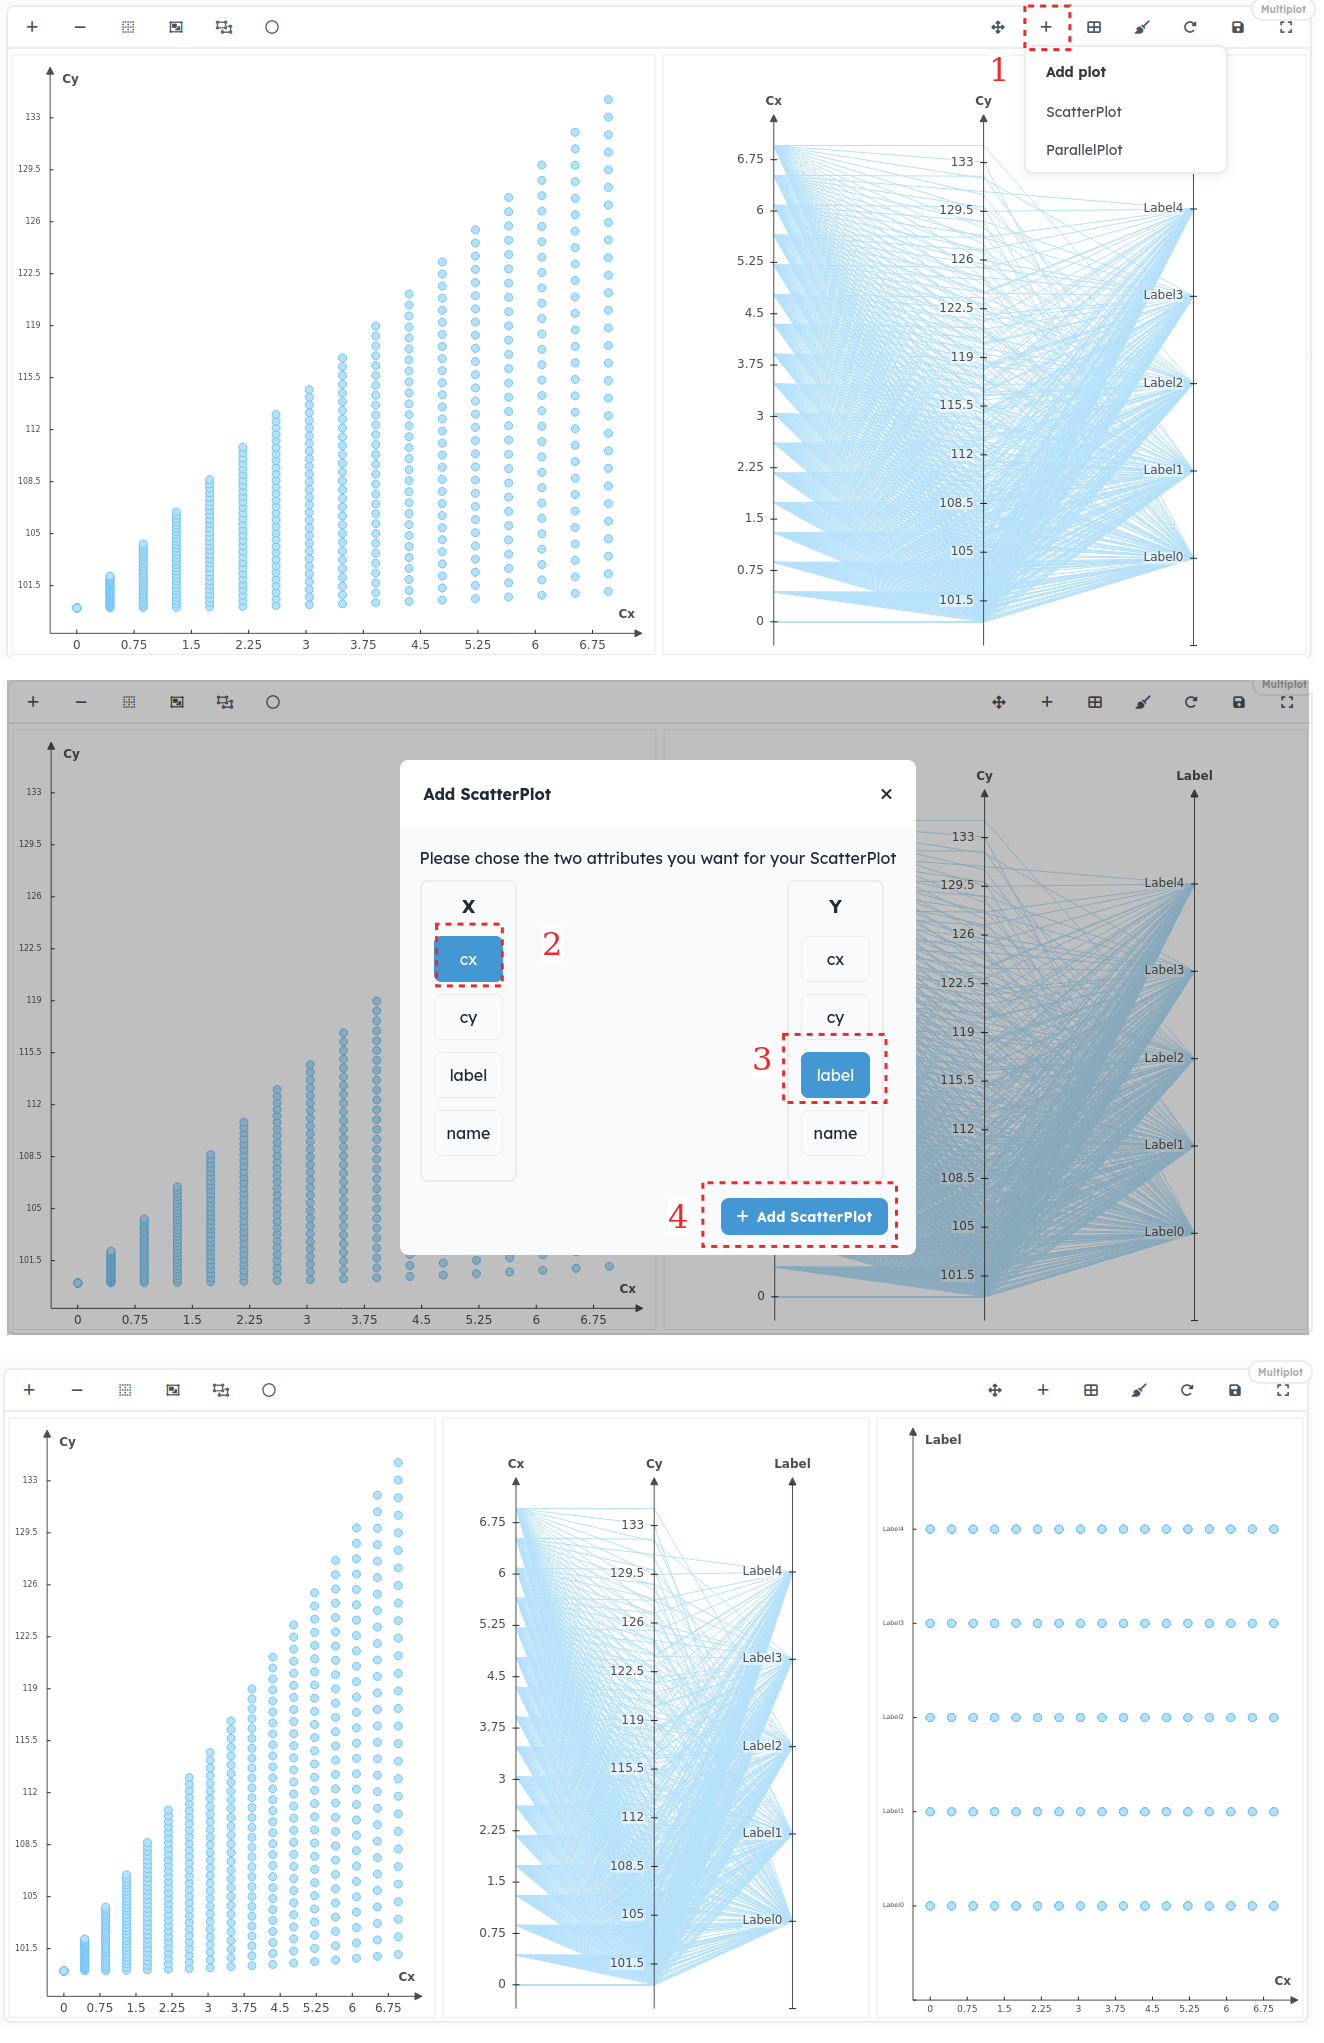
The Multiplot figure allows to dynamically add new Scatters or Parallel Plots on the existing view. WARNING: The added figures on Multiplot are not persistent. This means they won’t remain after a refresh or after leaving the current page.
Change Multiplot Layout#
The Multiplot figure allows to dynamically change figures layout on the existing view. WARNING: The custom layout of Multiplot is not persistent. This means it won’t remain after a refresh or after leaving the current page.
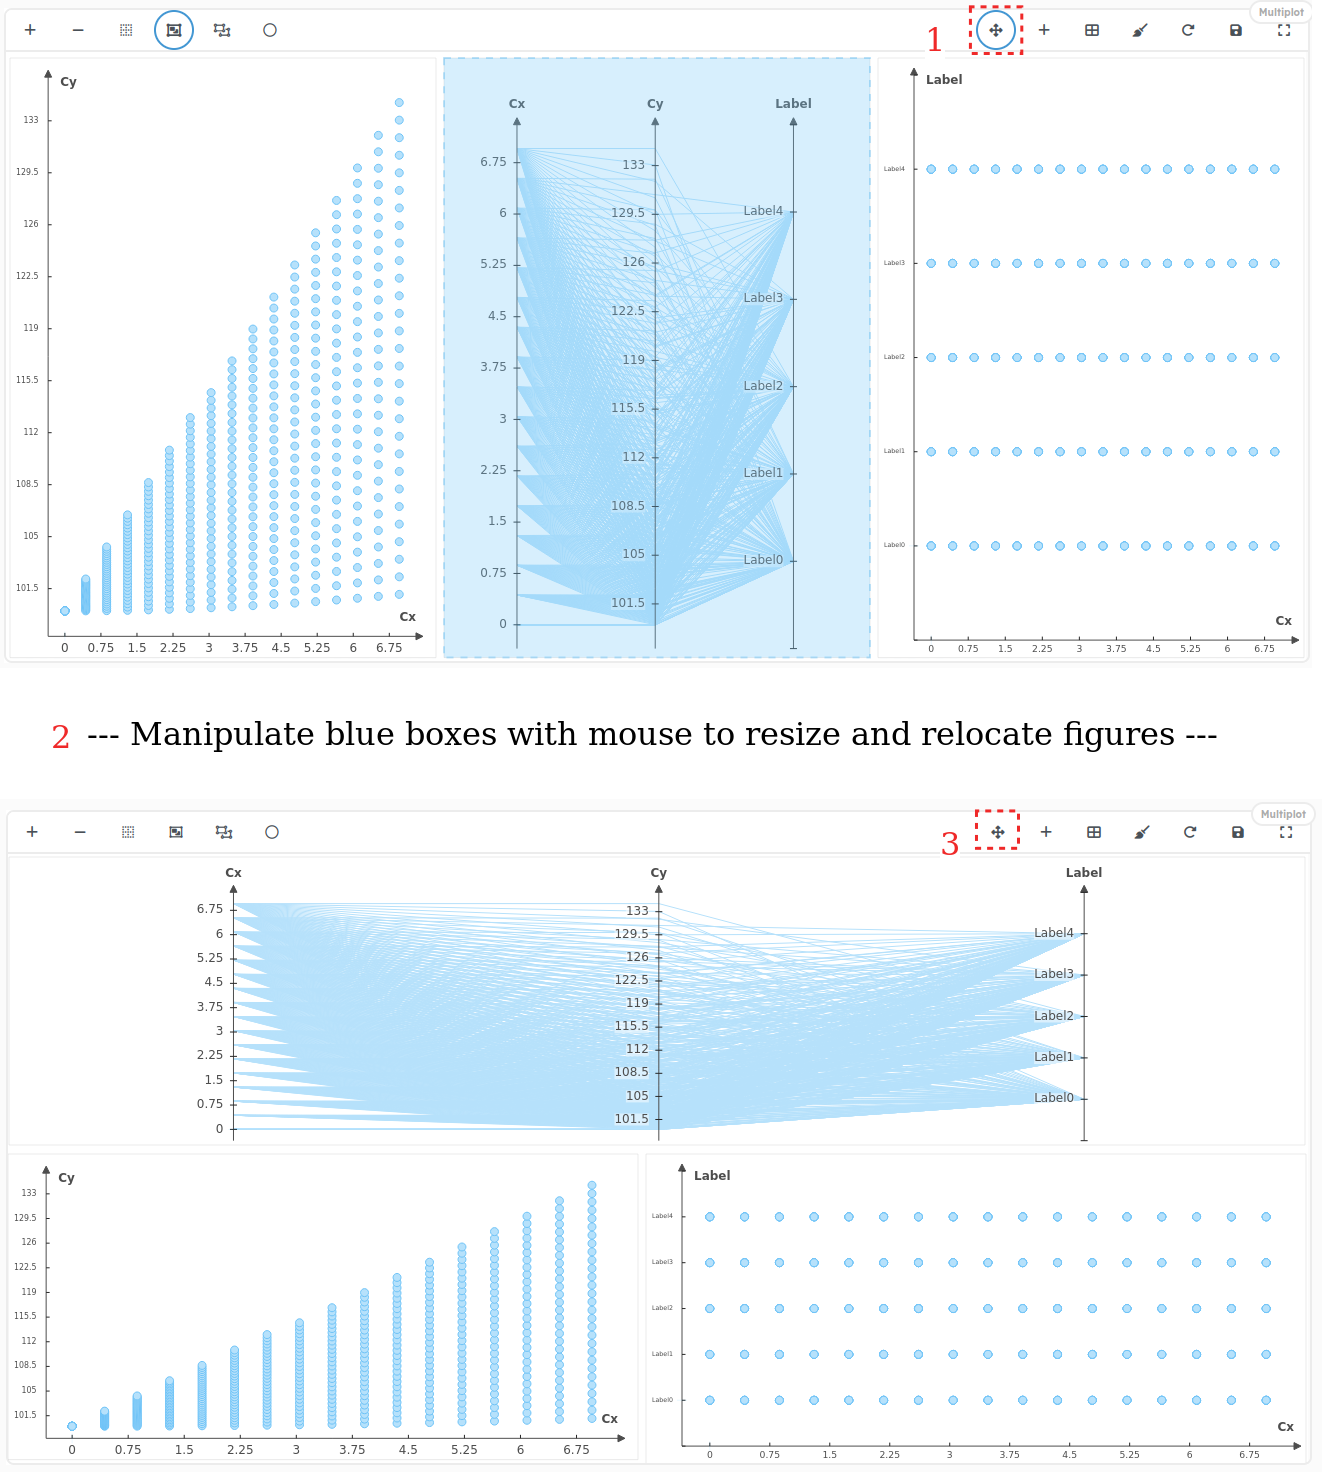
To cancel changes on the Multiplot layout, click on the Order Plots button

Create Points Sets#
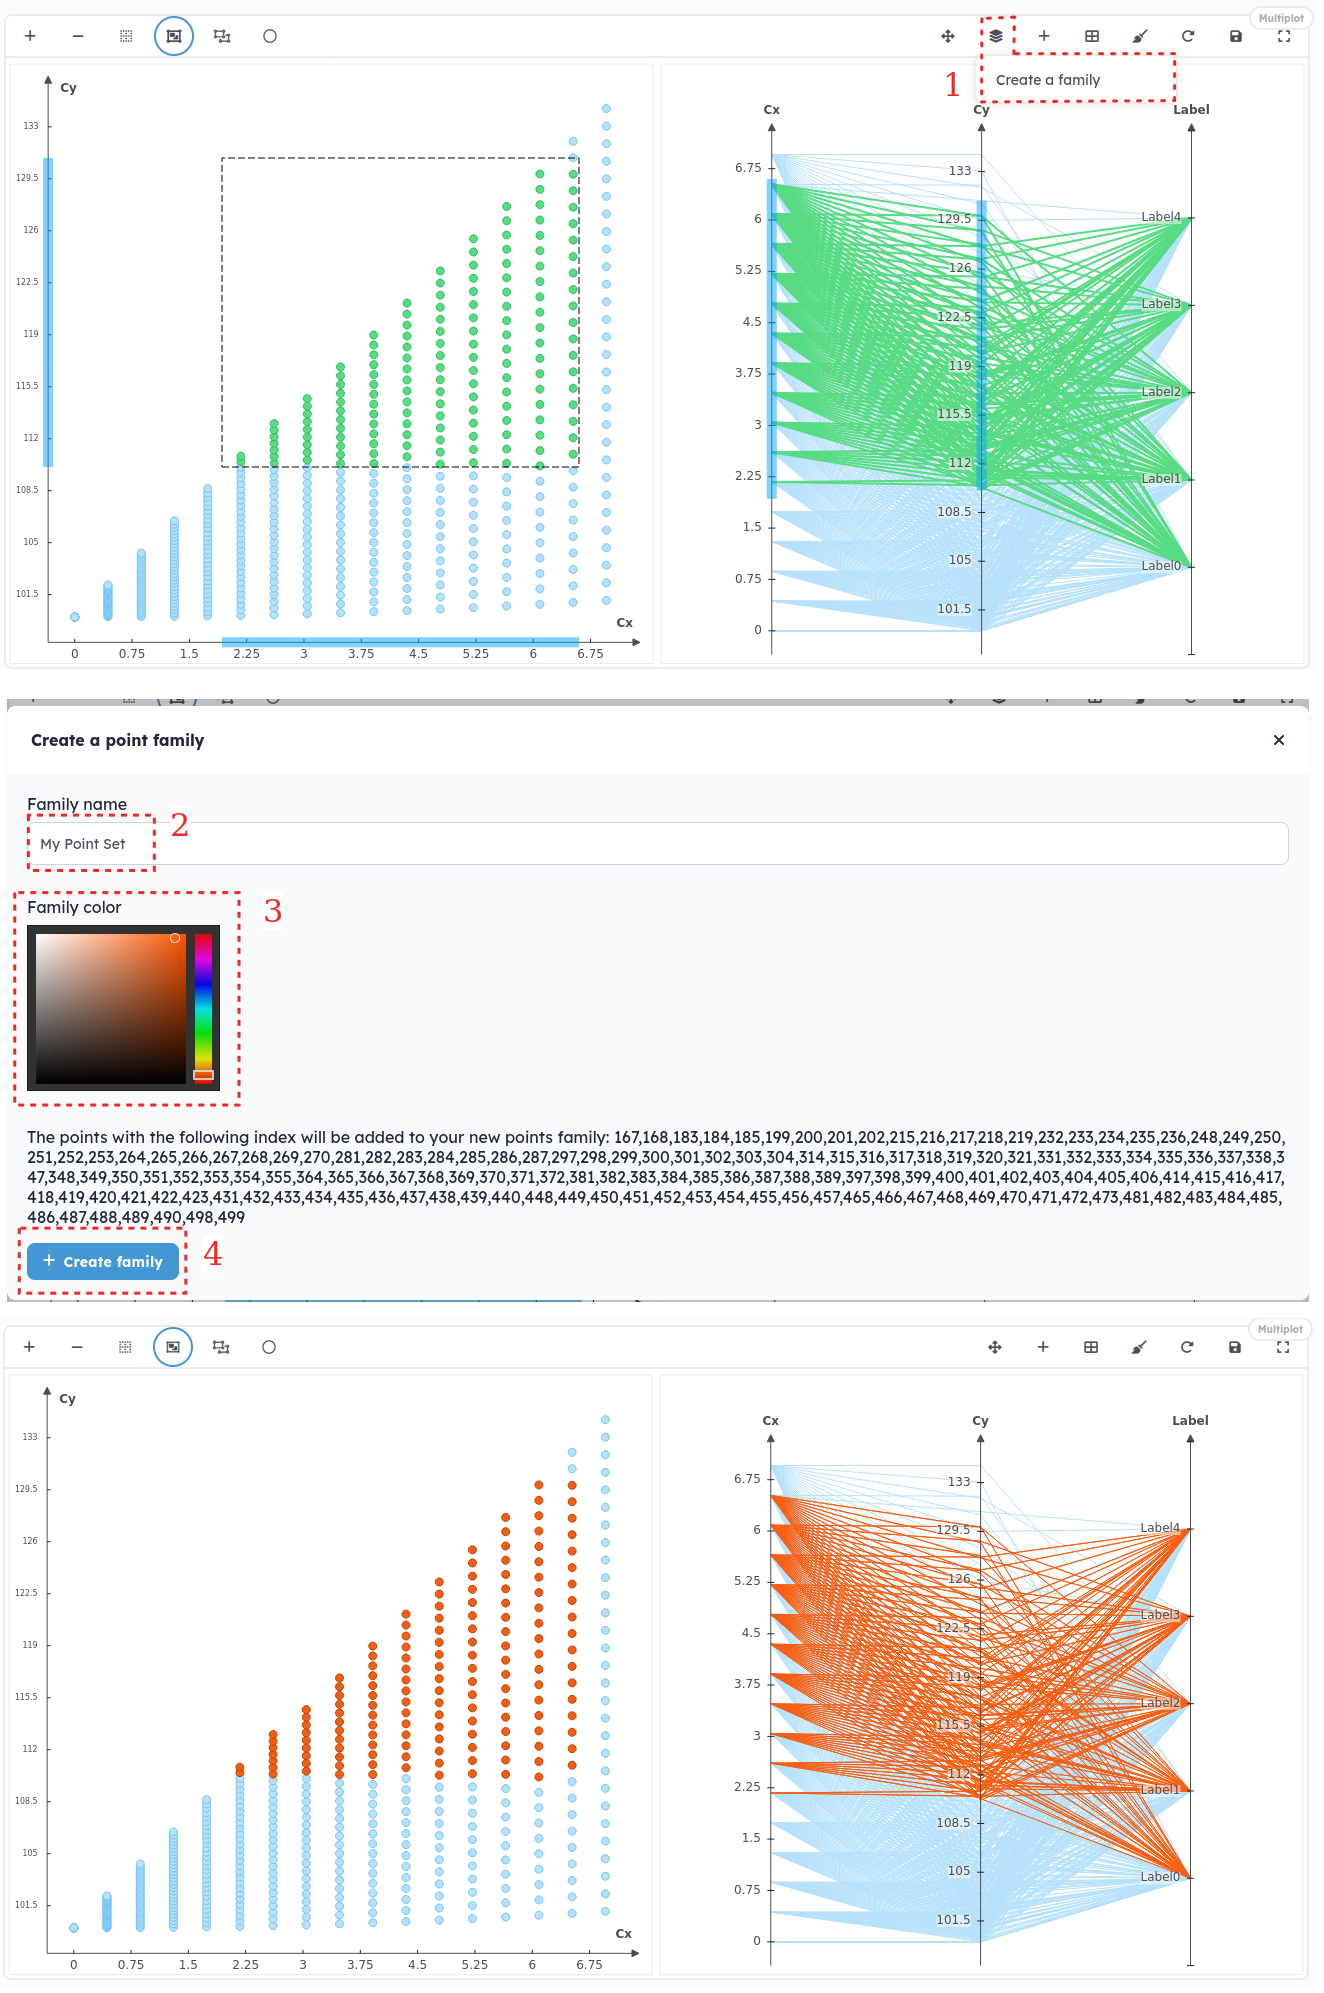
PlotData allows to dynamically add points to subsets for giving them a new color to get a better view of clusters in figures. To do it, select some points with the selection tools detailed before and add them to a PointFamily
WARNING: The custom points sets are not persistent. This means they won’t remain after a refresh or after leaving the current page.
